Rescroll

Free line graph animation maker

Type 3 to 12 values and download a line graph that draws itself through them, with a soft fill underneath and a chip counting the value at its tip. A 1080p MP4 made in your browser. Free, no sign-up, no watermark.

How it works

How to make a line graph animation.

Four steps, about a minute, and nothing to install.

  1. 1

    Type your points

    Add 3 to 12 points, each a short label and a value. Give the graph a title, and put a currency sign or a unit before or after the values.

  2. 2

    Shape the chart

    Choose a smooth curve or straight lines, a scale from zero or fitted to your values, and whether to show the fill, the dots, the gridlines, the labels and the change badge.

  3. 3

    Set the timing and the look

    The line draws in 1 to 20 seconds and rests on the finished graph for 1 to 5. Pick one of six looks, or your own line, text and background colors.

  4. 4

    Download the MP4

    Press Download. The video is rendered in your browser at 1080p and saved to your device. No account, no watermark.

When a line graph isn’t enough

The free line graph is the starting point.

This maker draws one line on a background. In Rescroll you describe the chart you want, such as “plot our monthly users from this spreadsheet and have the line reach the top as I say ‘a million’”, attach the data, and it's designed from scratch on your own video, timed to the exact word you say. Not right yet? Ask for the change in the chat.

Free line graph

Rescroll

One line graph, in your colors

Any chart you can describe, matched to your data, logo, fonts or a screenshot

A clip you overlay and key out yourself

Built on your own video, placed around you

You line it up in your editor

Lands on the exact word you say

Change it with the settings here

Change anything by asking in the chat

Part of the Pro, Ultimate and Scale plans.

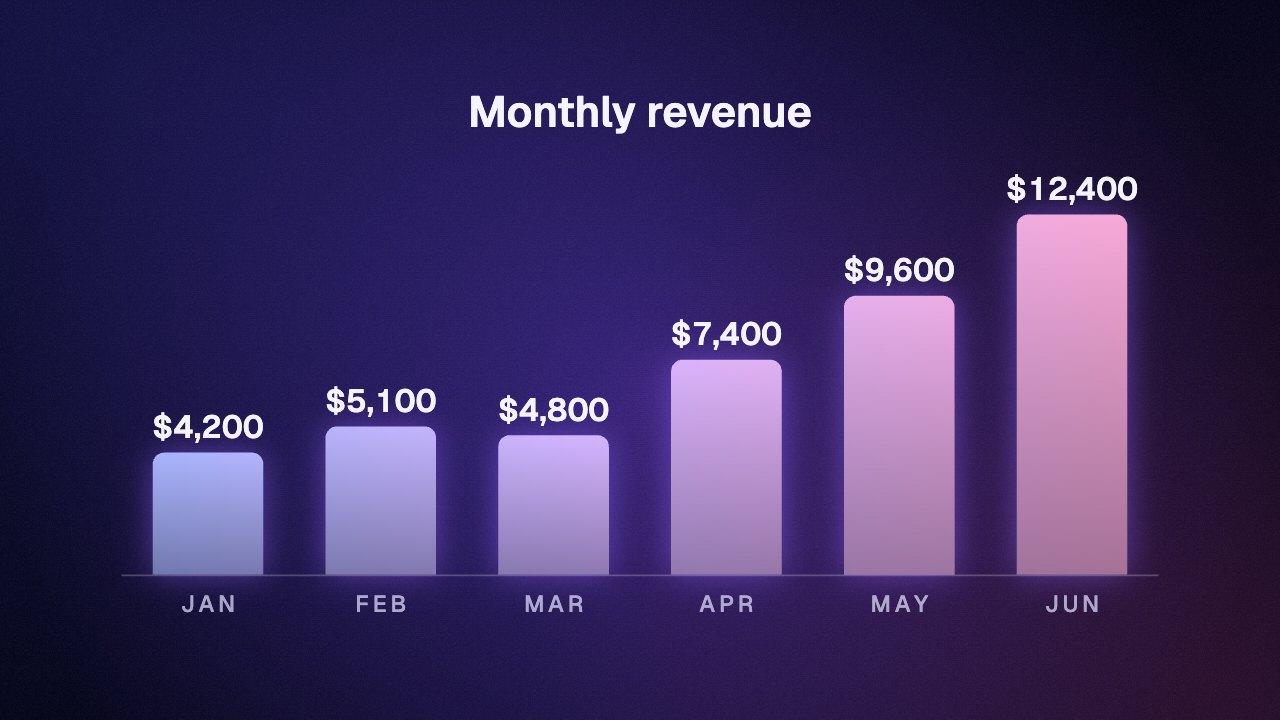
Revenue chart. A flat year, then the spike, on “this”.
A million users. The rollover lands on “million”.

Both built in Rescroll from a description.

The basics

What is a line graph animation?

A line graph animation is a short clip in which a line draws itself from left to right through a series of values, so the viewer watches a trend happen instead of reading it off a still chart. Editors use one for growth over time, a before and after, or any number that moved.

This maker draws the line through 3 to 12 points you type, each a label and a value. A bright head leads the line, a chip above it counts the value as it travels, and each dot pops as the head passes it. The scale, the gridlines and the labels under the line are worked out from your numbers.

Keep the labels short (Jan, Q1, 2024) and let the title say what is measured. If the change is small next to the values, say 182 to 190, choose Fit the values under Scale, so the movement fills the graph instead of running flat along the top.

What you download

Price
Free. No sign-up, no email, no watermark.
Format
MP4 (H.264), no audio
Resolution
1080p: 1080×1920, 1920×1080, 1080×1080 or 1080×1350
Frame rate
30 or 60 fps
Data
3 to 12 points, each a label of up to 10 characters and a value up to 999,999,999,999, above or below zero
Timing
Draws in 1 to 20 seconds, then rests 1 to 5 seconds on the finished graph
Styles
Smooth or straight line, with or without the fill, dots, gridlines and change badge
Colors
Six looks, any line, text and background color, or green and red by direction
Overlay
Green background for chroma key, or black for a Screen blend
Where it runs
In your browser. Nothing is uploaded.

In your editor

Put the line graph on your video.

An MP4 has no transparent background, so the line graph comes ready to key. Set the background to green and remove it with chroma key, or to black and use a Screen blend.

How to add a line graph in CapCut

Download the line graph on a green background. In CapCut, drag it onto the track above your video so it sits on top as an overlay. Select it, open Video → Remove BG → Chroma key, pick the green with the color picker and raise Strength until the background is gone. Menu names move a little between CapCut versions; look for Chroma key. If you made it on black instead, set the clip's blend mode to Screen.
How to add a line graph in Premiere Pro

Put the line graph on a video track above your footage. From the Effects panel, drag Ultra Key onto it and click the Key Color eyedropper on the green. For a version on black, skip the key: in Effect Controls, set Opacity → Blend Mode to Screen.

How to add a line graph in DaVinci Resolve

Place the line graph on the track above your footage. On the Edit page, open Effects → Open FX, find 3D Keyer under Resolve FX Key and drag it onto the clip, then sample the green in the viewer with the Open FX overlay switched on. For a version on black, set Composite Mode to Screen in the Inspector instead.

How to add a line graph in Final Cut Pro

Connect the line graph above your footage in the timeline. From the Effects browser, drag the Keyer effect onto it; it finds and removes the green by itself. For a version on black, set Blend Mode to Screen in the Video inspector.

Questions

Line graph animation: your questions, answered.

How do I make an animated line graph?

In the line graph maker at the top of this page, type a label and a value for each point, add a title, pick a look and press Download. You get a 1080p MP4 of the line drawing itself, made in your browser, with no sign-up and no watermark.

How many points can the line graph have?

From 3 to 12. Each point has a label of up to 10 characters and a value. When the labels would run into each other, the maker keeps every second or third one, always with the first and last.

Can I make the line straight instead of curved?

Yes. Under Chart, set Line to Straight for straight segments from point to point, which suits prices and scores. Smooth draws a curve through every point that never bulges above or below your values between them.

Can the line graph show negative numbers?

Yes. Values can go below zero, and the scale then includes the zero line, with the fill running from the line to zero on either side. Negative values are written with a minus sign.

What does Fit the values do?

It zooms the scale in on the range of your values instead of starting at 0, so a change from 182 to 190 fills the graph rather than sitting flat along the top. From zero is the honest choice when the size of the values matters.

How do I show the percentage change on the graph?

Turn on Change badge under Chart. When the line lands, a badge pops in beside the title with the change from the first value to the last, such as +350%. If the first value is 0, it shows the amount gained instead.

Can I add a dollar sign, a percent sign or a unit?

Yes. Before values and After values each take up to 6 characters, such as $ or %, and they're written on the chip and the scale. Values of a million or more are shortened to M, B or T on the chip.

How long is the line graph animation?

The line draws in 1 to 20 seconds, then the finished graph rests for 1 to 5 seconds, after a 0.6-second opening where the title and the scale come in. The defaults make a 5.6-second clip.

Can I hide the gridlines, the dots or the labels?

Yes. Gridlines and scale, Dots on the points and Fill under the line are switches under Chart, and Labels under the line can show all of them, only the first and last, or none.

Can I change the color of the line?

Yes. Pick a color under Line and text color in the Look panel, or choose one of six looks. Set Color the line by to Up or down for a line that's green when it ends higher and red when it ends lower.

Is the line graph maker free?

Yes. It's free to use and free to download, with no account, no email address and no watermark on the video. There's no limit on how many you make.

What format and resolution is the video?

An MP4 with H.264 video, at 1080p in the shape you choose: 1080×1920 (9:16) for TikTok, Reels and Shorts, 1920×1080 (16:9) for YouTube, 1080×1080 (1:1), or 1080×1350 (4:5) for the Instagram feed. You can export at 30 or 60 frames per second.

Can I get the line graph with a transparent background?

MP4 can't store transparency, so the line graph comes ready to key instead. Set the background to green and remove it with chroma key in your editor. If the graphic is light, you can also set the background to black and use the Screen blend mode. Either way only the line graph is left over your footage.

Is my video uploaded anywhere?

No. The line graph is drawn and encoded on your own device, using your browser's built-in video encoder. Nothing is sent to a server and there's no render queue.

Which browsers does it work in?

It needs a browser that can encode video with the WebCodecs API: current versions of Chrome, Edge and Safari, and Firefox on a computer. If your browser can't, the page tells you before you start.

Can I use the line graph in client work, ads or monetized videos?

Yes. The video you download is yours to use in personal and commercial projects, with no attribution needed.

Can I match my brand, add my logo or change the design?

Not in the free maker, which is deliberately simple. That's what Rescroll's AI motion graphics are for: describe the graphic you want in plain English, attach your logo, fonts or a screenshot of your style, and it's designed from scratch on your own video, placed around you and timed to the word you say. Ask for any change in the chat. It's part of the Pro, Ultimate and Scale plans.

Your next video,
edited like the top 1%.

Drop it in. Say what should appear. Read the plan, press Build, and export the finished video — no After Effects, no editor, no template.

Make your first graphic

Part of Pro, Ultimate and Scale · Export is free · Failed builds are refunded